Key Takeaways
- The top five Atlanta-region high-crash intersections in 2022 (GDOT data): Panola Road and Covington Highway (207 crashes); Covington Highway and South Hairston Road (154); North Hairston Road and Memorial Drive (140); Godby Road and Old National Highway (138); Tara Boulevard and Veterans Memorial Parkway (135).
- Buford Highway is Georgia's deadliest pedestrian corridor. Roughly 30 pedestrian deaths per year and 250+ pedestrian injuries per year across the 30-mile route; 154 pedestrians struck in the DeKalb segment alone since 2003, per Smart Growth America and Georgia DOT data summarized by Montlick & Associates.
- The Downtown Connector (I-75 / I-85) logged 3,353 crashes in 2024 — roughly nine per day — with six fatalities, per WSB-TV's review of GDOT data.
- Five-county metro Atlanta saw 425 traffic deaths in 2024 — more than the 410 homicides the same year, according to the Propel ATL 2024 Five-County Report. DeKalb County led the region with 121 traffic deaths and 40 pedestrian or cyclist deaths.
- Georgia personal-injury claims arising from these crashes must be filed within two years under O.C.G.A. § 9-3-33, with modified comparative-negligence under O.C.G.A. § 51-12-33 reducing recovery by the plaintiff's share of fault.
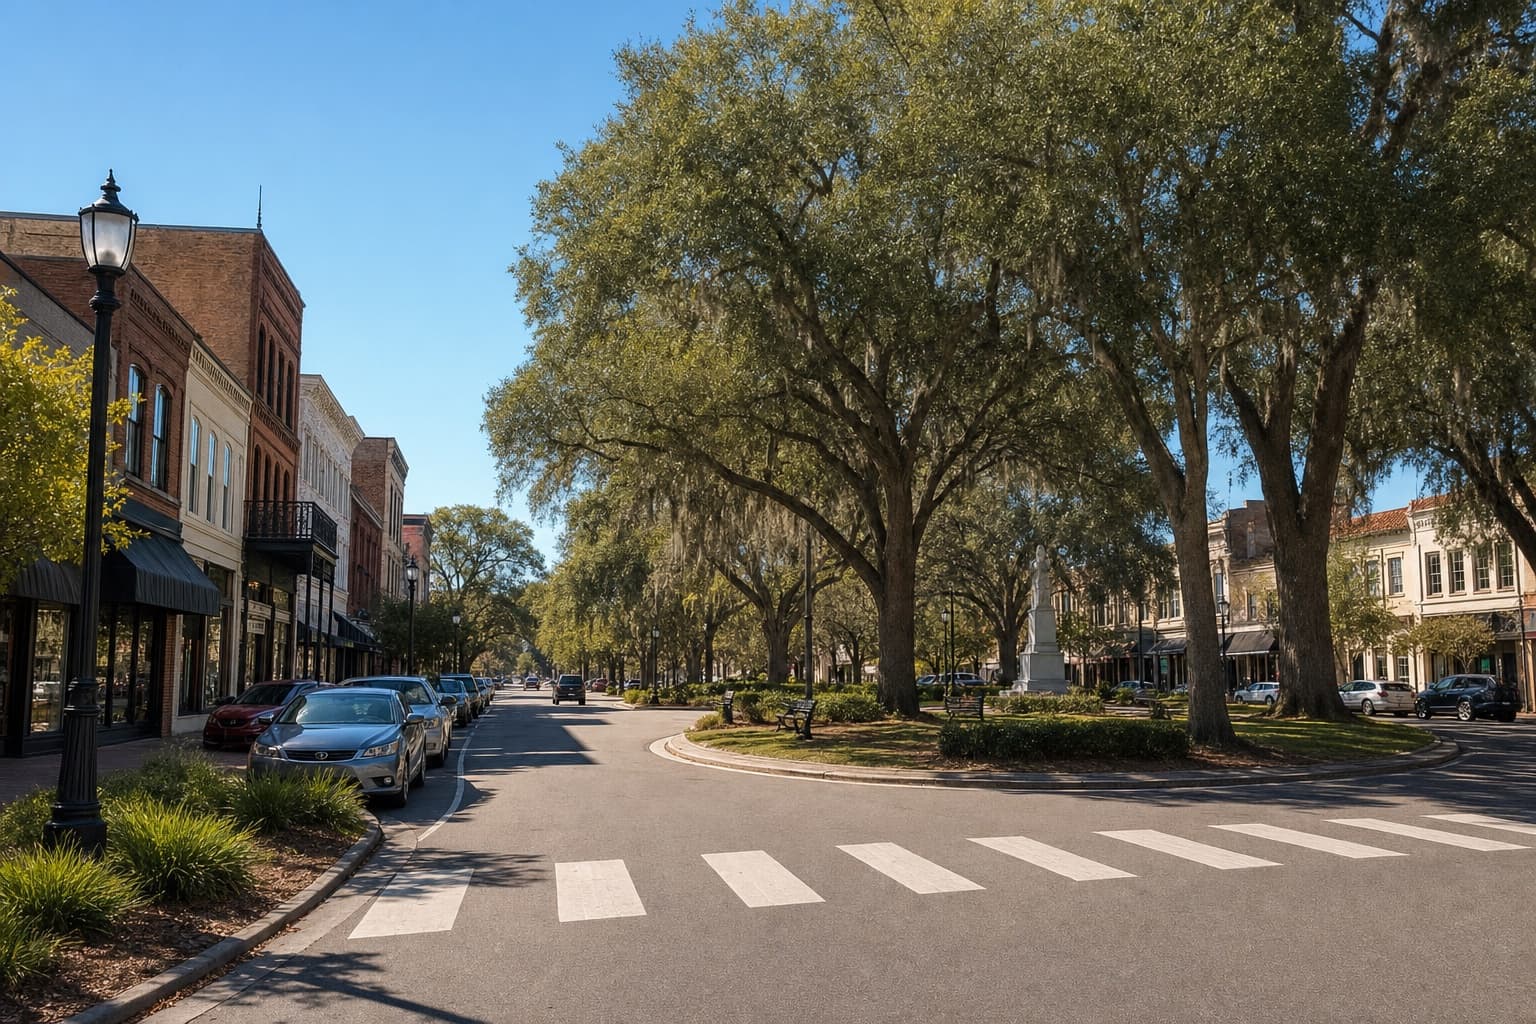
Atlanta's most dangerous traffic streets are not a matter of opinion. The 2022 Georgia Department of Transportation crash analysis identified the highest-crash intersections by name and count. The City of Atlanta's Vision Zero High Injury Network identifies the corridors where roughly 73% of fatal and serious-injury crashes happen on less than 10% of city streets. Smart Growth America's "Dangerous by Design 2022" report names Buford Highway as the case study for pedestrian-fatality risk in the South. This 2026 guide pulls those primary sources together — by intersection, by corridor, by interstate, by time of day — with the verified numbers and citations behind each ranking.
The five highest-crash intersections in metro Atlanta (2022 GDOT data)
The Georgia Department of Transportation maintains a crash-reporting system that ranks intersections by total reported collisions. The 2022 analysis, summarized by WSB-TV from GDOT source data, produces the following ranking for the Atlanta region:
| Rank | Intersection | County | 2022 Crashes |
|---|---|---|---|
| 1 | Panola Road & Covington Highway | DeKalb / Clayton border | 207 |
| 2 | Covington Highway & South Hairston Road | DeKalb | 154 |
| 3 | North Hairston Road & Memorial Drive | DeKalb | 140 |
| 4 | Godby Road & Old National Highway | Fulton / Clayton border | 138 |
| 5 | Tara Boulevard & Veterans Memorial Parkway | Clayton | 135 |
Four of the top five sit in DeKalb or Clayton County — not the City of Atlanta itself — reflecting how the region's highest-volume crash hotspots cluster along suburban arterials that carry interstate-spillover traffic without interstate-grade design. Three of the five are on Covington Highway (US-278) or its intersecting cross-streets. Two are on Old National / Tara Boulevard, the I-285 / I-85 / I-75 spillover corridor south of Hartsfield-Jackson.
The common design failure across the top five: high-speed surface arterials (45–55 mph posted) intersecting cross-streets at six-lane uncontrolled or signal-only crossings, without protected left turns, pedestrian refuges, or dedicated turn-storage. The crash mix is heavy on rear-end and angle collisions, with elevated KSI severity because of the higher operating speeds.
Buford Highway: Georgia's deadliest pedestrian corridor
Buford Highway runs 30 miles from Atlanta's Lindbergh neighborhood northeast through Brookhaven, Chamblee, Doraville, and Duluth. It is the single most-documented dangerous road in Georgia by pedestrian-fatality count.
The verified numbers, drawn from Georgia DOT crash data, Smart Growth America's Dangerous by Design 2022 report, and ongoing AJC investigative reporting:
- Approximately 30 pedestrian fatalities per year on the corridor.
- 250+ pedestrian injuries per year across the corridor.
- 154 pedestrians struck in the DeKalb County segment alone since 2003.
- 8 of the 30 miles are officially recognized by GDOT as high-risk for pedestrians.
- The Atlanta-Sandy Springs-Alpharetta metro ranks 29th deadliest of the 101 largest U.S. metros for pedestrian fatalities at 2.71 deaths per 100,000 residents per year.
The design problem is well-understood. Buford Highway was built as a high-speed commercial arterial — six to seven lanes wide, posted at 45 mph, with a continuous two-way center turn lane — through what has since become one of metro Atlanta's most densely-populated immigrant and transit-dependent corridors. Mid-block crossings can be a quarter-mile or more apart. Sidewalks, where they exist, are narrow and pushed against the travel lanes. Bus stops sit on the opposite side of the road from the apartment complexes that depend on them. Most fatalities occur after dark and cluster in fall and winter months when daylight ends before the evening commute.
Recent reporting underscores the pace: the AJC documented multiple Buford Highway hit-and-run pedestrian deaths across 2024 and 2025. The Federal Highway Administration's Vulnerable Road User framework now requires Georgia DOT to produce a VRU Safety Assessment (FY2024 published), which informs the corridor RSA prioritization.
For a Georgia pedestrian-accident victim or family, Buford Highway cases carry a recurring evidentiary fingerprint: lighting conditions at the crash time, distance to the nearest controlled crossing, presence or absence of mid-block sidewalks, and the local government's RSA history for that specific segment can all establish the corridor's known-dangerous condition for purposes of a premises-and-design negligence claim against the responsible road authority.
Atlanta's High Injury Network: where 73% of severe crashes happen
The City of Atlanta's Vision Zero High Injury Network identifies the approximately 10% of city streets that account for 73% of all fatal and serious-injury crashes on Atlanta surface roads. The current HIN includes the following corridors as priority safety-investment streets:
- Memorial Drive — Phase 2 of GDOT's Memorial Drive improvements was announced in August 2023, with planned protected two-way bike lane (Pearl Street to Trinity Avenue), mid-block pedestrian crossings, ADA sidewalk repairs, and left-turn restrictions at high-conflict intersections. Per Propel ATL, the corridor has produced sustained fatal-crash concentration for over a decade.
- Moreland Avenue (US-23) — Major east-side high-injury corridor; carries Moreland Avenue commuter traffic into the I-20 interchange south of Little Five Points.
- Piedmont Avenue (Midtown) — Recent AJC traffic reporting documents an average of approximately three crashes per week on the Midtown stretch.
- Cleveland Avenue — Persistent south-Atlanta corridor with documented pedestrian-injury concentration.
- Bouldercrest Road — High-crash south-of-I-285 corridor, identified in Vision Zero analysis.
- Campbellton Road — Designated for Vision Zero quick-build treatments and a planned MARTA Bus Rapid Transit corridor.
- Roswell Road (SR-9, north) — High-volume Buckhead-area corridor.
The HIN designation matters legally because it creates a documented governmental record that the responsible road authority (City of Atlanta, Fulton or DeKalb County, or GDOT depending on the segment) knew the corridor was dangerous before any individual crash. In Georgia, that prior-knowledge record can be a key element in cases against the public road authority alongside the private driver's negligence.
Have Questions About Your Case?
Get a free consultation with an experienced Georgia accident attorney.
Other notoriously dangerous corridors: Stone Mountain Freeway, Camp Creek Parkway, North Druid Hills Road
Three corridors that appear in older Atlanta dangerous-roads coverage and in everyday driver experience still warrant attention even though they do not top the GDOT 2022 intersection ranking:
Stone Mountain Freeway (US-78)
US-78 runs east from I-285 through Stone Mountain Park into Gwinnett. Posted at 55 mph through most of DeKalb, the corridor mixes interstate-style speeds with a string of at-grade traffic signals at East Park Place Boulevard, Mountain Industrial Boulevard, Hugh Howell Road, and the Stone Mountain Park entrance. The speed-differential at signals is the corridor's signature crash mechanism: a 55 mph posted speed dropping to zero at a red light produces rear-end and high-energy angle collisions concentrated in the lane closest to the median.
Camp Creek Parkway (SR-6)
Camp Creek Parkway is a south-Fulton arterial running between East Point, South Fulton, and the area immediately west of Hartsfield-Jackson International Airport. Not in Johns Creek. The corridor's Butner Road intersection sits in unincorporated Fulton County south-west of the airport, and is among the higher-volume cross-street conflicts on the route. Camp Creek's design problem is similar to Buford Highway: six lanes, 45–55 mph posted, retail and apartment land use along the shoulders, sparse mid-block pedestrian crossings.
North Druid Hills Road
North Druid Hills Road carries cross-Buford-Highway traffic between Briarcliff Road and the Toco Hills area into the I-85 / North Druid Hills interchange. The Briarcliff-and-North-Druid-Hills intersection is a documented high-conflict signal because of the offset cross-street geometry, the volume of left-turn movements from Briarcliff onto North Druid Hills, and the surrounding commercial-retail land use.
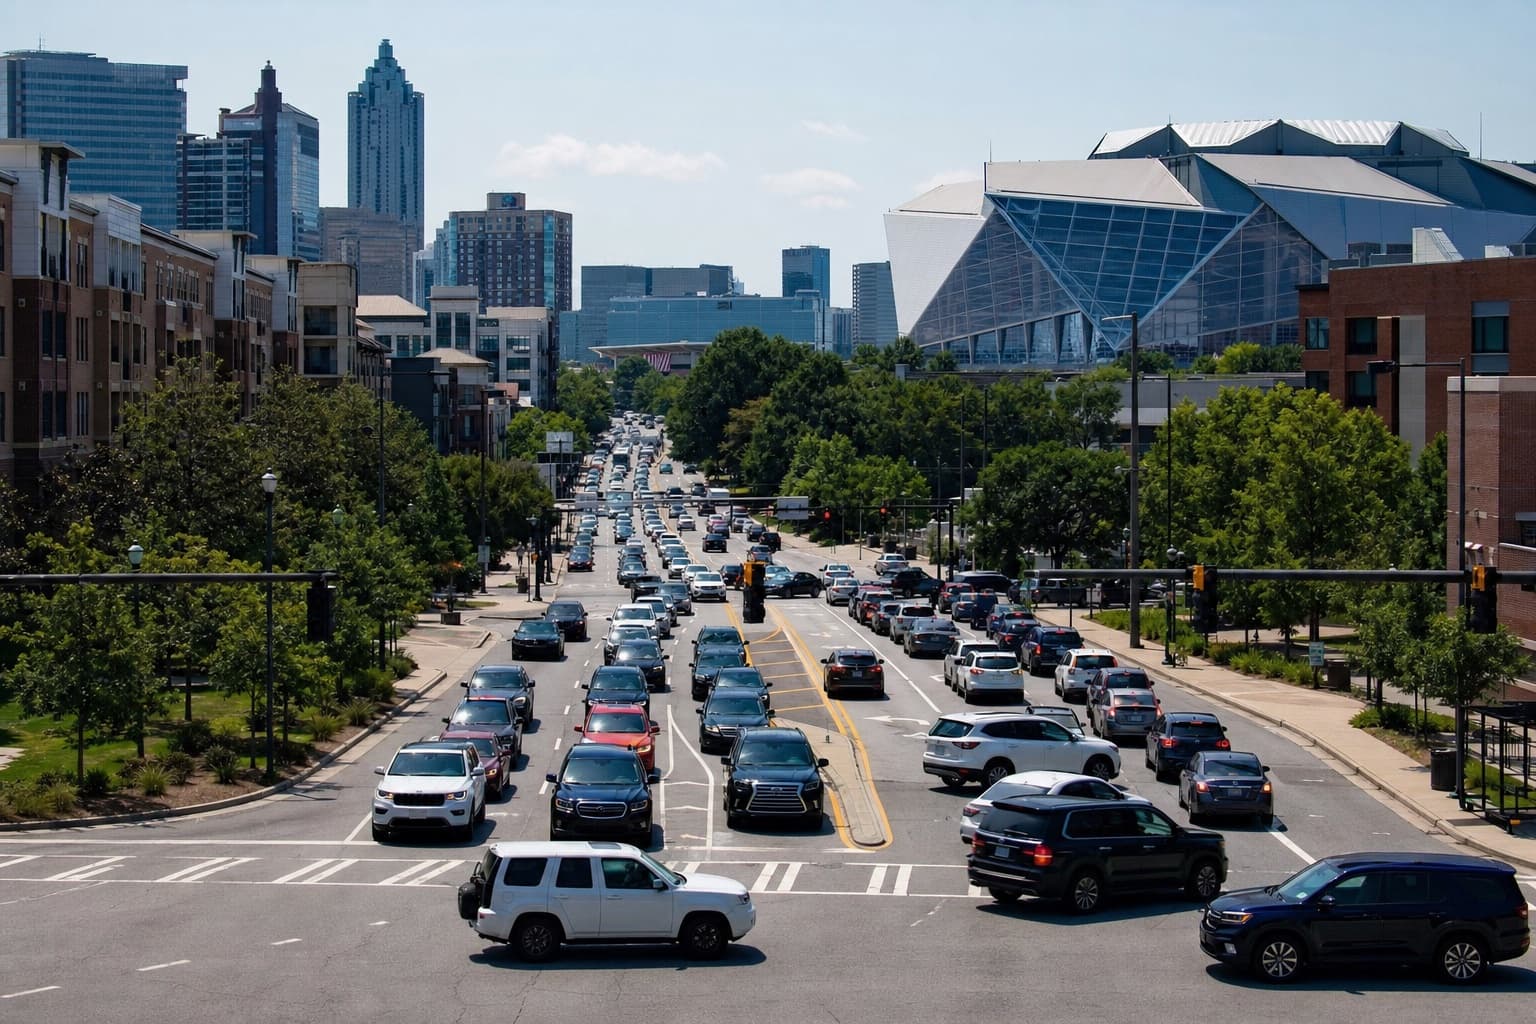
The Downtown Connector and metro interstates
Three Atlanta interstate corridors carry the bulk of regional fatal-crash exposure:
| Corridor | 2024 Crashes | 2024 Fatalities | Notable design factor |
|---|---|---|---|
| Downtown Connector (I-75 / I-85) | ~3,353 | 6 | High volume, weave zones, wrong-way intrusions, pedestrian incursion from adjacent streets |
| Interstate 20 (Atlanta segment) | ~1,627 | 4+ | Heavy freight volume, congestion at Connector and I-285 interchanges |
| Interstate 285 ("the Perimeter") | Multiple high-density zones | ~3.5 fatal per 10 miles per year | Aging design, lane-change conflicts, freight-heavy ramps at I-20, I-75, I-85, I-575, I-985, and GA-400 interchanges |
The I-285 fatal-crash rate of approximately 3.5 fatalities per 10 miles per year runs about 75% above the national urban-interstate average, per the Federal Highway Administration's interstate-segment safety analysis and regional summaries.
The Connector itself has produced sustained fatal-crash concentration because of the merge geometry where I-75 and I-85 northbound traffic interleaves under the Brookwood interchange, and where southbound traffic re-splits at the Langford Parkway / University Avenue ramps. Wrong-way driver incursions from the Brookwood and 14th Street ramps have produced multiple wrong-way fatal crashes documented in the GDOT crash reporting database.
For commercial-vehicle fatal crashes specifically on these interstates, the rules differ. Federal regulations under 49 CFR § 387.9 require interstate carriers to carry a minimum of $750,000 in liability coverage — 7.5 times the Georgia intrastate minimum — and the discovery process for Georgia truck-accident cases reaches federal hours-of-service logs, ELD data, and driver-qualification files that don't exist in passenger-vehicle cases.
Vision Zero Atlanta: the official program and its numbers
The City of Atlanta adopted Vision Zero in April 2020 via Ordinance 20-O-1239, committing to eliminate all traffic deaths and serious injuries on Atlanta streets by 2040. The Vision Zero Action Plan was published in November 2023 by the Atlanta Department of Transportation in coordination with the Atlanta Regional Commission and more than 35 stakeholder agencies.
The program's published metrics:
- 2021: 100 traffic fatalities on Atlanta city streets — the highest in a decade.
- 2023: 47 traffic fatalities on city surface streets — a 23% reduction from the 2021 peak.
- Default city speed limit: 25 mph on the majority of city-owned streets.
- Fatal Crash Review Commission: Quarterly multi-agency review of every fatal crash on city streets, with countermeasure recommendations.
- Quick-build tactical urbanism program: Curb extensions, painted medians, crossing refuges, and pop-up bike lanes deployed in the 60–180-day range on documented high-crash corridors.
The HIN designation drives where the City prioritizes its annual capital safety budget, and the Fatal Crash Review Commission's recommendations are public record once issued.
Metro Atlanta fatal-crash counts and the equity gap (2024)
The Propel ATL 2024 Five-County Report, summarizing GOHS county data and APD crash records, found:
- 425 traffic deaths in 2024 across Clayton, Cobb, DeKalb, Fulton, and Gwinnett counties — more than the 410 homicides recorded in the same region the same year.
- DeKalb County led the region with 121 traffic deaths and 40 pedestrian or cyclist deaths.
- Fulton County recorded 93 fatalities, 944 serious injuries, and 51,572 total crashes (GOHS).
- 152 pedestrian and cyclist serious injuries in Fulton alone in 2024.
- An equity gap in fatal-crash distribution: 61% of regional traffic fatalities occurred in census tracts that are predominantly Black, even though those tracts represent 43% of the region's census tracts.
The five-year trend, reading the GOHS County Data Sheets end-to-end, shows traffic fatalities elevated above pre-pandemic baselines in DeKalb, Clayton, and South Fulton, while the City of Atlanta's surface-street fatality count fell off the 2021 peak under Vision Zero enforcement.
When the deadliest crashes happen: time-of-day and day-of-week patterns
Atlanta crash data shows three distinct daily peaks and a separate impaired-driving cluster:
- 3:00 p.m. – 6:00 p.m. (PM rush) — Primary all-crash peak. Volume + sun-glare + fatigue at the end of the workday.
- 12:00 p.m. – 3:00 p.m. (midday) — Secondary peak driven by lunch trips, delivery vehicles, and school-zone activity.
- 6:30 a.m. – 9:30 a.m. (AM rush) — Tertiary peak with rear-end and merge-conflict mix.
- Midnight – 3:00 a.m. (DUI window) — Distinct impaired-driving cluster. Roughly 40% of Georgia's alcohol-related traffic fatalities occur in the Atlanta metro, and Friday and Saturday nights show 2–3× the weekday DUI-arrest rate.
The DUI window is the highest-severity window of the week. Speeds are higher (open road, no congestion), restraint use is lower, and reaction times are degraded by impairment. Holiday periods — Memorial Day weekend, Independence Day, Labor Day, Thanksgiving, and the New Year's Eve / Day window — show 2–3× the normal DUI arrest count and elevated fatal-crash totals in every Atlanta metro county.
What Georgia DOT is doing about it: Road Safety Audits and corridor mitigation
GDOT has formally committed to four Road Safety Audits per year in metropolitan Atlanta: two on transit corridors with documented pedestrian fatal-injury history, and two on general high-crash corridors. The audit framework uses AASHTOWare Safety (powered by Numetric) for data-driven candidate selection, then convenes an interdisciplinary team for the on-corridor field examination.
Concurrent mitigation projects:
- MARTA Rapid A-Line BRT (bus rapid transit) launched in 2026, with dedicated lanes and safer pedestrian crossings.
- MARTA new bus network (April 2026) delivers 15-minute service to three times as many residents and rebalances routing on high-injury corridors.
- Memorial Drive Phase 2 — protected bike lane, mid-block crossings, signal upgrades, expected complete in the FY2026–2027 build cycle.
- Campbellton Road BRT — under construction with parallel safety treatments for the surface road.
- GDOT signal-modernization at high-crash intersections, including adaptive signal control on selected arterials.
For a Georgia auto-accident victim or family, the existence of these documented audits, designations, and mitigation timelines can be load-bearing evidence — both for the responsible road authority's prior knowledge of the danger and for the spoliation timeline on physical evidence (traffic-signal logs, GDOT camera footage, and intersection-controller data are routinely overwritten on 30- to 90-day cycles).
Practice pointer
"The biggest mistake I see Atlanta crash victims make is treating the road itself as a static fact. It isn't. On a corridor like Buford Highway or Memorial Drive, the City and the County both have documented prior-knowledge records — Vision Zero designations, RSA findings, fatal-crash review commission minutes — and those records have a discovery half-life. The signal-controller data, the camera footage, and even the asphalt-condition reports get overwritten or lost on 30- to 90-day cycles. Preserving them in the first weeks after a crash is what separates a recovery against the driver alone from a recovery that reaches the road authority."
— Mark Wade, Managing Partner, Georgia Auto Law
A Georgia personal injury attorney's first job in a high-injury-network or known-dangerous-corridor crash is to identify every responsible party — the at-fault driver, the road authority, the contractor, the rideshare or fleet operator — before the documentary trail erodes. For Atlanta truck-accident and rideshare cases, the trail erodes faster: ELD data and TNC app-status records are routinely purged on tight cycles, and the prior-knowledge record of the dangerous corridor itself is a separate parallel claim against the road authority that has to be preserved early.
Frequently Asked Questions
What is the single most dangerous traffic street in Atlanta?
By 2022 Georgia DOT crash count, the highest-crash intersection in the Atlanta region is Panola Road and Covington Highway in DeKalb County, with 207 crashes. By pedestrian-fatality count, the deadliest corridor is Buford Highway, which sees roughly 30 pedestrian deaths per year. The single "most dangerous street" depends on which metric — total crashes, pedestrian fatalities, or fatal-and-severe-injury concentration — you anchor the question on.
What are the five highest-crash intersections in Atlanta?
The 2022 GDOT ranking, summarized by WSB-TV: (1) Panola Road and Covington Highway, 207 crashes; (2) Covington Highway and South Hairston Road, 154 crashes; (3) North Hairston Road and Memorial Drive, 140 crashes; (4) Godby Road and Old National Highway, 138 crashes; (5) Tara Boulevard and Veterans Memorial Parkway, 135 crashes.
How many people die in metro Atlanta traffic crashes each year?
Per the Propel ATL 2024 Five-County Report (Clayton, Cobb, DeKalb, Fulton, Gwinnett), there were 425 traffic deaths in 2024. That exceeded the 410 homicides recorded in the same region during the same year. DeKalb County led the region with 121 traffic deaths.
Why is Buford Highway so dangerous for pedestrians?
Buford Highway is a 30-mile, six-to-seven-lane high-speed arterial (posted at 45 mph) that runs through one of metro Atlanta's most densely-populated transit-dependent corridors. Mid-block crossings can be a quarter mile or more apart, sidewalks are narrow where they exist at all, and most fatalities occur after dark when transit-dependent residents are walking between bus stops and apartment complexes. Roughly 30 pedestrians are killed and 250+ injured on the corridor each year.
What is Atlanta's High Injury Network?
The High Injury Network is the City of Atlanta's official designation, under its Vision Zero program, for the streets where the largest share of fatal and serious-injury crashes happen. Approximately 73% of fatal and serious-injury crashes occur on less than 10% of Atlanta's street miles — the HIN identifies those streets so the City can concentrate safety investment there.
When did Atlanta adopt Vision Zero?
The City of Atlanta adopted Vision Zero in April 2020 via Ordinance 20-O-1239, committing to eliminate all traffic deaths and serious injuries on Atlanta streets by 2040. The Vision Zero Action Plan was published in November 2023.
Has Vision Zero reduced traffic deaths in Atlanta?
City surface-street fatalities fell from 100 in 2021 (a decade peak) to 47 in 2023 — a 23% reduction. The total includes only city-owned street fatalities and excludes interstate fatalities, which sit under federal and state jurisdiction.
What is the most dangerous interstate in Atlanta?
The Downtown Connector (I-75 / I-85) logged the highest crash count at approximately 3,353 crashes in 2024 with six fatalities. Interstate 285 (the Perimeter) carries the highest fatal-crash rate at approximately 3.5 fatal crashes per 10 miles per year — about 75% above the national urban-interstate average.
What time of day are Atlanta crashes worst?
Overall crash volume peaks 3:00–6:00 p.m. during the afternoon rush. Impaired-driving fatal crashes cluster midnight to 3:00 a.m., especially on Friday and Saturday nights and during the major holiday windows (Memorial Day, July 4th, Labor Day, Thanksgiving, New Year's).
Are interstates more dangerous than surface streets in Atlanta?
By crash count, the Downtown Connector dwarfs any single surface street at 3,353 crashes in 2024. By fatal-crash rate per mile, Interstate 285 leads. By pedestrian-fatality count, no Atlanta interstate matches Buford Highway's 30-per-year figure. The right answer depends on the metric — and on whether the user is in a vehicle or on foot.
Where can I see Georgia's official crash data?
Three primary sources: the Georgia DOT Crash Reporting System maintains the master state crash database; the Georgia Governor's Office of Highway Safety publishes county-by-county data sheets; and NHTSA's Fatality Analysis Reporting System (FARS) is the federal fatal-crash database with Atlanta-coded records.
Is distracted driving really a factor in over half of Georgia crashes?
The "over half" framing is widely cited but reads as overstated. The closer-verified figure: distracted driving is a documented contributing factor in roughly 25–30% of Georgia injury crashes according to NHTSA and Georgia State Patrol data. The Hands-Free Georgia Act (effective July 1, 2018) made handheld-device use while driving a primary offense; subsequent state-patrol enforcement data show citations clustered in metro Atlanta with elevated rates on the Connector and on Buford Highway.
What can I do if I'm hit on a documented dangerous corridor?
Preserve corridor-specific evidence in the first weeks: the responsible road authority's High Injury Network designation, Road Safety Audit history, traffic-signal controller logs, GDOT camera footage, and Fatal Crash Review Commission records for that segment. These documents have discovery half-lives measured in days or weeks for the electronic evidence, and they support a parallel claim against the road authority alongside the at-fault driver. Georgia's two-year statute of limitations under O.C.G.A. § 9-3-33 applies, and claims against city or county government typically require an ante-litem notice within six months.
How does Georgia's modified comparative negligence rule apply to crashes on dangerous corridors?
Under O.C.G.A. § 51-12-33, Georgia recovery is reduced by the plaintiff's share of fault and is barred entirely if the plaintiff is 50% or more at fault. On a documented High Injury Network corridor, the road authority's known-dangerous condition can shift apportionment toward the road authority and the at-fault driver and away from the injured plaintiff.
Who is responsible when a Buford Highway crash kills a pedestrian?
Liability typically reaches multiple defendants: the driver, the driver's employer (if commercial), the rideshare or delivery platform (if app-on), and potentially the road authority (Georgia DOT, DeKalb County, or the relevant municipality) under a known-dangerous-condition theory backed by the Federal Highway Administration's VRU Safety Assessment framework and Smart Growth America's published corridor-risk data. Wrongful-death recovery in Georgia follows the full-value-of-the-life standard under O.C.G.A. § 51-4-1 et seq. and is recoverable by the surviving spouse, children, or parent depending on family structure. See our Atlanta wrongful-death guide for the procedural specifics.